Part III: Chaos
10. Nonlinear Dynamics in Simple Maps
Read the opening pages · printed page 139
The Bifurcation Diagram (bifur1d.c (and gen1d.c, phase1d.c))
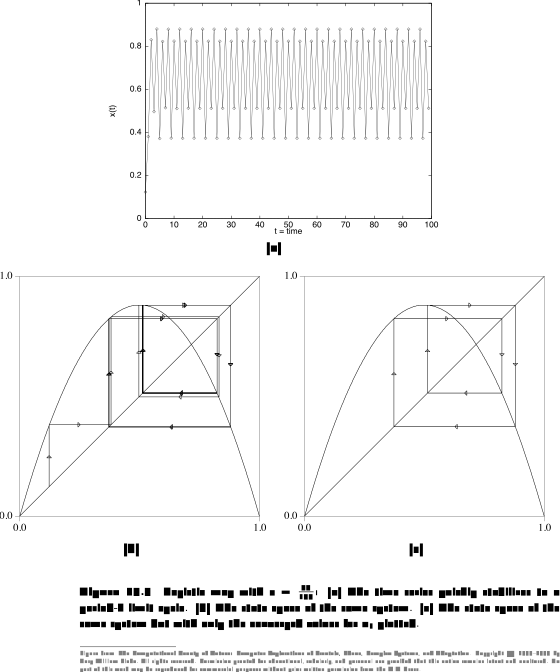
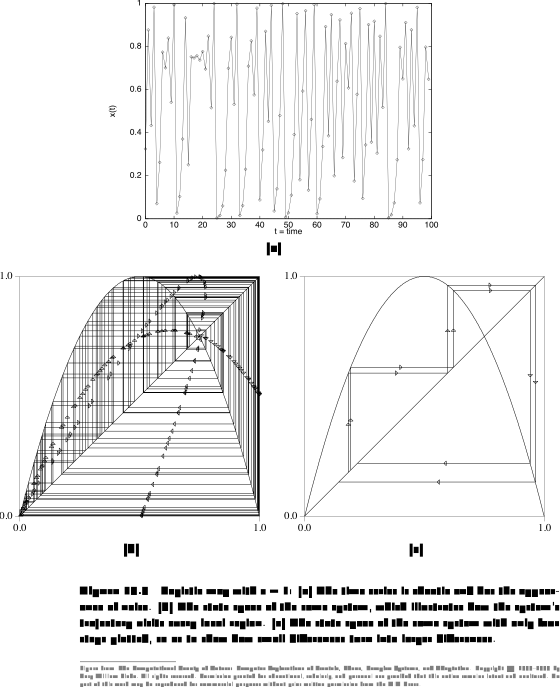
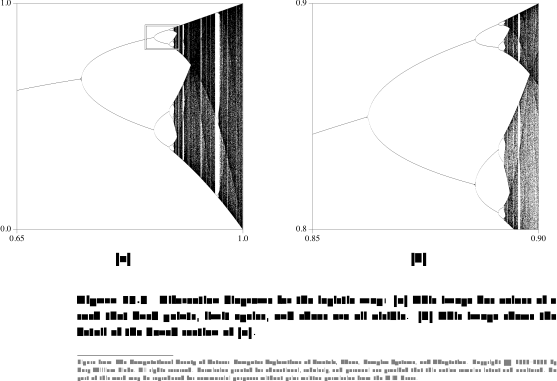
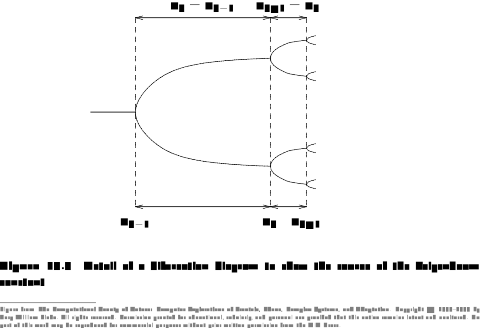
The logistic map, x becomes 4rx(1-x), is a one-line model of a population with limited food. For each value of r the program runs the map a while and plots where it ends up. Small r gives a single steady value, then it splits in two, then four, then eight, at intervals shrinking by Feigenbaum's constant, until the values fill whole bands: chaos, with windows of order inside it. The view starts just before the first split and then zooms into the cascade to show that the whole diagram repeats inside itself. Full screen →
Sections
- The Logistic Map
- Stability and Instability
- Bifurcations and Universality
- Prediction, Layered Pastry, and Information Loss
- The Shadowing Lemma
- Characteristics of Chaos
- Further Exploration
- Further Reading